Some say LOS* is Dead. Its Not. Here's why LOS is more important than ever---
*LOS = Level of Service, a metric use for ranking traffic congestion
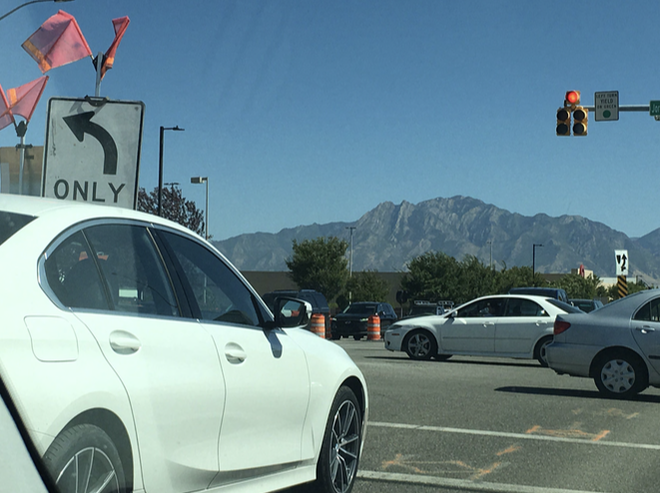
In the City of Pasadena, CA, a Traffic Engineer chasing LOS F conditions, live.
Traffic Conditions in Pasadena, CA like so many other cities in California, keep getting worse as traffic continues to grow, and mitigations of major projects instead focus on providing bike and pedestrian facilities. Such is the consequence of using only Vehicle Miles Traveled (VMT) instead of Level of Service (LOS) to measure traffic impacts.
|
PRISM Engineering was hired recently to study traffic in Pasadena, CA. Here is one of many surveys taken by PRISM in Feb 2020.
The Complete Streets Act of 2008 in California, requires that Cities and Counties and Caltrans to have a transportation network that meets the needs of ALL users of streets, roads, and highways, defined to include:
MOTORISTS, PEDS, BIKES, TRANSIT etc. Note that "MOTORISTS" are included in the law. These can NOT be ignored. Many cities in California have been focusing on Complete Streets concepts and taking away needed lanes from vehicle traffic to make room for bike lanes, TWLTL*, and pedestrian facilities, or transit. Adding a light rail, for instance, can impact vehicle flow significantly, as can be seen several times in this video. When traffic conditions are nearing capacity, as they are in this video, solutions that examine the traffic operations as a whole are needed, since a cursory calculation of LOS at a single intersection is insufficient to identify the real problems. An intersection may calculate at LOS C for instance, the average of all four approaches, but there may be an LOS F condition for one of the approaches that affects the surrounding streets in addition to the intersection. When traffic has to wait more than one signal cycle, that traffic is at LOS F conditions. This is because it only takes 80 seconds of delay to meet the LOS F threshold. Most signal cycles are at least 80 seconds long, so if you miss the green light time, and have to wait even longer, you are going to be at the unacceptable LOS F condition. This video shot and narrated by California registered Traffic Engineer Grant Johnson, shows many locations in this situation. Take a look. *TWLTL=Two-way left turn lane, sometimes referred to as a "suicide lane" in the middle of a road |
This optional change gives "IN-FILL" development a pass on being accountable for REAL traffic impacts and congestion on the roads, because it happens to be a high density skyscraper, which is deemed good for the environment, even if it isn't.
The fact is, skyscrapers with their very tall presence on a small footprint generates a lot more traffic than a shorter building. Vehicle traffic impacts continues to matters, even if many cities choose to ignore the constant vehicle growth. Ignoring traffic impacts while the accidents rates get worse and there is a rising number of vehicle collisions year by year. Safety has been COMPROMISED. LOS measures the movement of vehicles, and it is actually related to safety. VMT has no relationship to safety, at all. However, LOS is a measurement of congestion and delay, and these two factors have much to do with safety and accident rates on the rise. More drivers take chances when they are delayed. The transportation systems need to address this majority component of traffic, not ignore it and let it fester. |
|
SAFETY has got to come FIRST when modifying our transportation systems with Complete Streets.
One can not ignore the psychology of the citizens within the country where Complete Streets concepts are being considered. |
CALTRANS SAYS:
Every complete street looks different, according to its context, community preferences, the types of road users, and their needs. |
|
Governments all over the world have been racing to install measures and policy to help combat negative environmental impacts related to transportation. But in the process of trying to mitigate these environmental impacts by legislating measures to reduce carbon footprints, the basics of traffic engineering have largely been ignored in the last decade by advocates of alternative modes of travel and active transportation. Not that these are not important, because they are (riding bikes and more people walking in an active lifestyle), but in the process of installing cookbook road diets and complete streets there has often been a throwing of vehicular traffic under the bus, literally.
|
When Traffic Congestion meets a CrossWalk:
|
|
Taking away lanes on existing crowded roadways where LOS F currently exists is a mistake that leads to a kind of chaos where drivers are adjusting to significantly increased congestion conditions. Taking lanes away from cars to restripe and make room for bike lanes without regard to the very real impacts that this may have on capacity (depends on traffic volume being over capacity or not) can cause significant impact to the time and lives of the vast majority of people that use these roads, in a car. In some few cases where capacity has been taken away from a crowded road, essentially a social engineering experiment to see if people will get out of their cars (which has yet to actually work in the real world), this can lead to very real driver frustrations. As a result, drivers may try to game the system and there could likely be an impact to SAFETY, especially to pedestrians who have to compete with a disgruntled driver.
As a Traffic Engineer interested in SAFETY FIRST, I advocate looking at solutions that make sense from a safety standpoint first, and then using common sense to consider driver psychology of a person behind the wheel of a car who has been significantly delayed. All it takes is a small percentage of drivers to wreak havoc in a transportation system, creating dangerous situations by speeding, ignoring signs/signals, etc. It has always been a small percentage of drivers that cause the 40,000 fatalities each year by speeding, texting, raging, inattention, or worse, impaired driving. It is not possible to directly fix this no matter how hard we try, as long as there are human drivers with a small subset that takes big and irresponsible risks while driving. We still have a constant of 40K fatalities each year in the USA, and it is precisely because we can't fix that demographic. This is an argument in favor of autonomous vehicles!
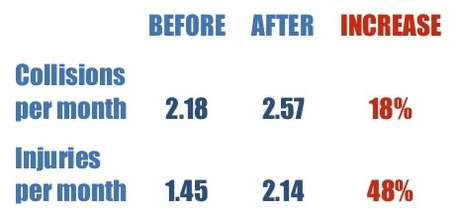
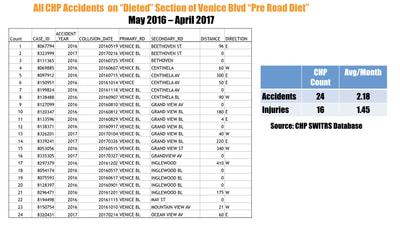
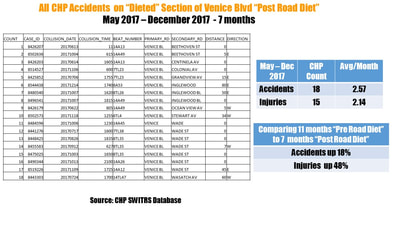
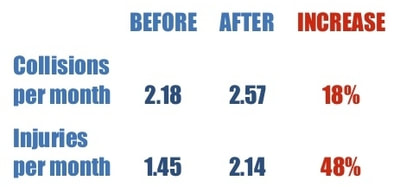
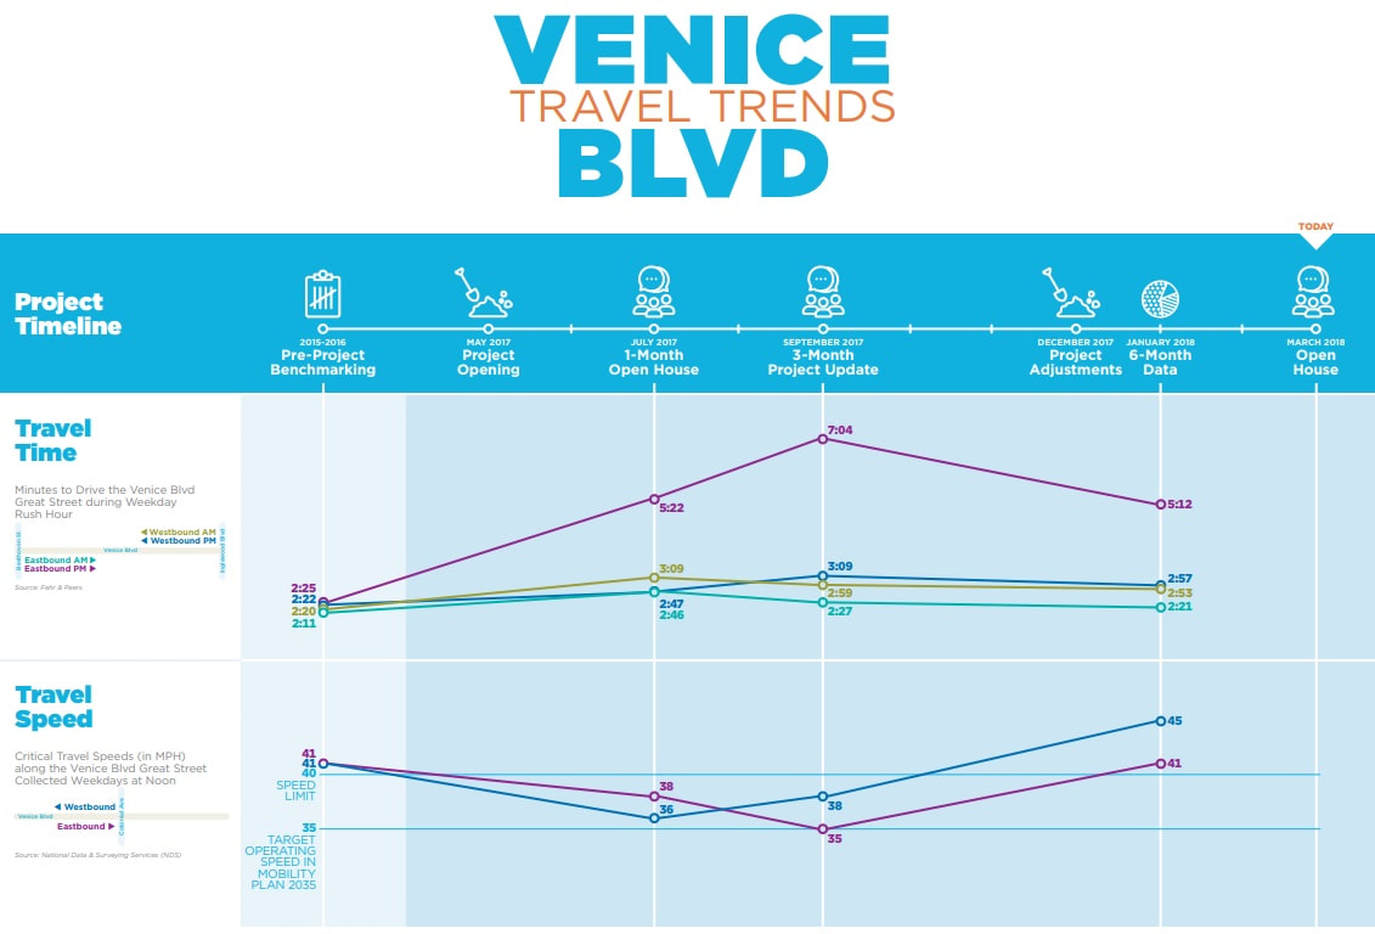
Accepting this fact will help us understand that Vision Zero is not possible until that demographic is addressed, and redesigning the busiest roads with diets, to make drivers of cars even more delayed, more frustrated, is not the answer. Road candidates for road diets must be within the reasonable capacity after lane confiscations. There must be no traffic jams created! It will make this small demographic behave even more badly. The road after Complete Streets may look like it is safer on paper, but if some drivers behave worse in tense traffic jams because of it, then this is an unintended consequence. Los Angeles recently installed some Complete Streets designs on Venice Blvd in Mar Vista, and the accident rates have gone UP, not down. The travel times have DOUBLED, not remained the same (which were not very good to begin with). Here is a sample of what happened, BEFORE and AFTER Complete Streets Road Diet on Venice Blvd:
|
An example of crossing a busy road in China, even with a crosswalk, it was dangerous because of
the culture of drivers in a hurry, not being careful for pedestrians. HOW to protect against this? (as it happens in the USA too)
|
|
In the chart below as reported by the City's consultant Fehr and Peers on LA.STREETSBLOG.ORG, it can be seen that speeds INCREASED, which is the opposite intended result. Also travel times more than DOUBLED which is not a good outcome for drivers already frustrated with the changes.
SOURCE: https://la.streetsblog.org/2018/03/15/six-month-mar-vista-venice-blvd-great-streets-check-in-results-inconclusive/ |
Constituents in Los Angeles are talking about increased driver frustration, more accidents, and closures of some business (seven so far) where parking was eliminated by Complete Streets Road Diets, and a there was no compensation to merchants suffering a resulting loss in patronage. One can read about this experience HERE. They are saying:
|
|
FROM CITYWATCHLA.COM:
"Statistics from the Los Angeles Department of Transportation during the first six months of the road diet trial, the only data now available:
https://www.citywatchla.com/index.php/2016-01-01-13-17-00/los-angeles/15435-city-council-throwing-91-million-more-into-road-diets-ignoring-data-exposing-the-venice-blvd-experiment-as-an-epic-fail |
What Happened Here? Why did the Complete Streets Road Diet Fail?
SAFETY was not considered FIRST. Social Engineering was attempted, and there was no regard to an already LOS F condition for cars. Making LOS F twice as bad by taking away 50% of the lanes is not a good idea. Public Workshops were also said to be more of a formality than a real exchange of ideas and concerns, because there was no discussion with the public.
There are in reality, only a relatively few streets in existence today that can truly benefit from a Complete Streets Road Diet because most streets are already saturated with vehicles, this one was over capacity at 37,000 ADT and two lanes were removed! You can hardly fit 20,000 ADT on a two lane road, let alone 37,000! There is no other better place for them to go by doing this. It won't adjust correctly in the system. If you constrain a busy corridor so that it goes from 4 lanes to only 2 lanes for vehicles, you have cut the roadways capacity in half, and this has serious ramifications. This will cause drivers of vehicles to find alternative routes, and many of these alternative routes are going to be residential streets. The result is the volume of traffic on a road on a "Road Diet" is going to go DOWN... of course it will. Its going to go somewhere else, not disappear! And this will result in a loss of exposure to store fronts of merchants who relied on pass-by traffic. Venice Blvd traffic went down 30%, that's 30% less exposure. This leads to loss of sales, and it will lead to a loss of the business entirely in some cases where profit margins were tight to begin with. So we have these unintended impacts/consequences that seem to make things better for cyclists and peds, but worse for merchants and local residential streets. I say seem, because pedestrian fatalities in LA have nearly doubled in the last two years, not come down. It is, by the numbers, NOT safer for pedestrians in LA. Some Road Diets on over-capacity streets are merely pushing the traffic to other streets, because the cars are not going to go away. In fact, in the USA, car ownership is still growing per household, up to 91% now from 87% in 1980. People have grown to RELY on their vehicles to get around, and this trend is growing not only in the USA, but in China too where car ownership is literally exploding (where it used to be only 10% of the population that owned a car, now it is jumping towards 20% and still growing, doubling their already congested traffic). This demand for CARS should not be ignored by transportation planners who have sought ideas to try and get people "out of their cars," but it has not been successful in doing that. This experiment has been taking place for about a decade now, and it is not changing the landscape overall. The opposite has been happening.
There are in reality, only a relatively few streets in existence today that can truly benefit from a Complete Streets Road Diet because most streets are already saturated with vehicles, this one was over capacity at 37,000 ADT and two lanes were removed! You can hardly fit 20,000 ADT on a two lane road, let alone 37,000! There is no other better place for them to go by doing this. It won't adjust correctly in the system. If you constrain a busy corridor so that it goes from 4 lanes to only 2 lanes for vehicles, you have cut the roadways capacity in half, and this has serious ramifications. This will cause drivers of vehicles to find alternative routes, and many of these alternative routes are going to be residential streets. The result is the volume of traffic on a road on a "Road Diet" is going to go DOWN... of course it will. Its going to go somewhere else, not disappear! And this will result in a loss of exposure to store fronts of merchants who relied on pass-by traffic. Venice Blvd traffic went down 30%, that's 30% less exposure. This leads to loss of sales, and it will lead to a loss of the business entirely in some cases where profit margins were tight to begin with. So we have these unintended impacts/consequences that seem to make things better for cyclists and peds, but worse for merchants and local residential streets. I say seem, because pedestrian fatalities in LA have nearly doubled in the last two years, not come down. It is, by the numbers, NOT safer for pedestrians in LA. Some Road Diets on over-capacity streets are merely pushing the traffic to other streets, because the cars are not going to go away. In fact, in the USA, car ownership is still growing per household, up to 91% now from 87% in 1980. People have grown to RELY on their vehicles to get around, and this trend is growing not only in the USA, but in China too where car ownership is literally exploding (where it used to be only 10% of the population that owned a car, now it is jumping towards 20% and still growing, doubling their already congested traffic). This demand for CARS should not be ignored by transportation planners who have sought ideas to try and get people "out of their cars," but it has not been successful in doing that. This experiment has been taking place for about a decade now, and it is not changing the landscape overall. The opposite has been happening.
|
In 1980, 87.% of American households owned one or more motor vehicles, and today this number is 91.3% indicating just the opposite effect desired by transportation planners is taking place! People are not abandoning their cars. They are not, overall, shifting to other modes.
In nearly every city in the USA, the number of vehicles per household has INCREASED from 2015 to 2016. See the following interactive MAP for proof of this. Pick a city with mouse click: |
Cars Per Household for U.S. Cities Map (almost all ratios go UP in 2016)
Source: Governing calculations of 2015 and 2016 one-year Census American Community Survey estimates. Note that one-year estimates have high margins of error for smaller cities.
The Los Angeles Times Reports: PEDESTRIAN FATALITIES SURGE 80% with Complete Streets Road Diet
|
FROM The Los Angeles Times:
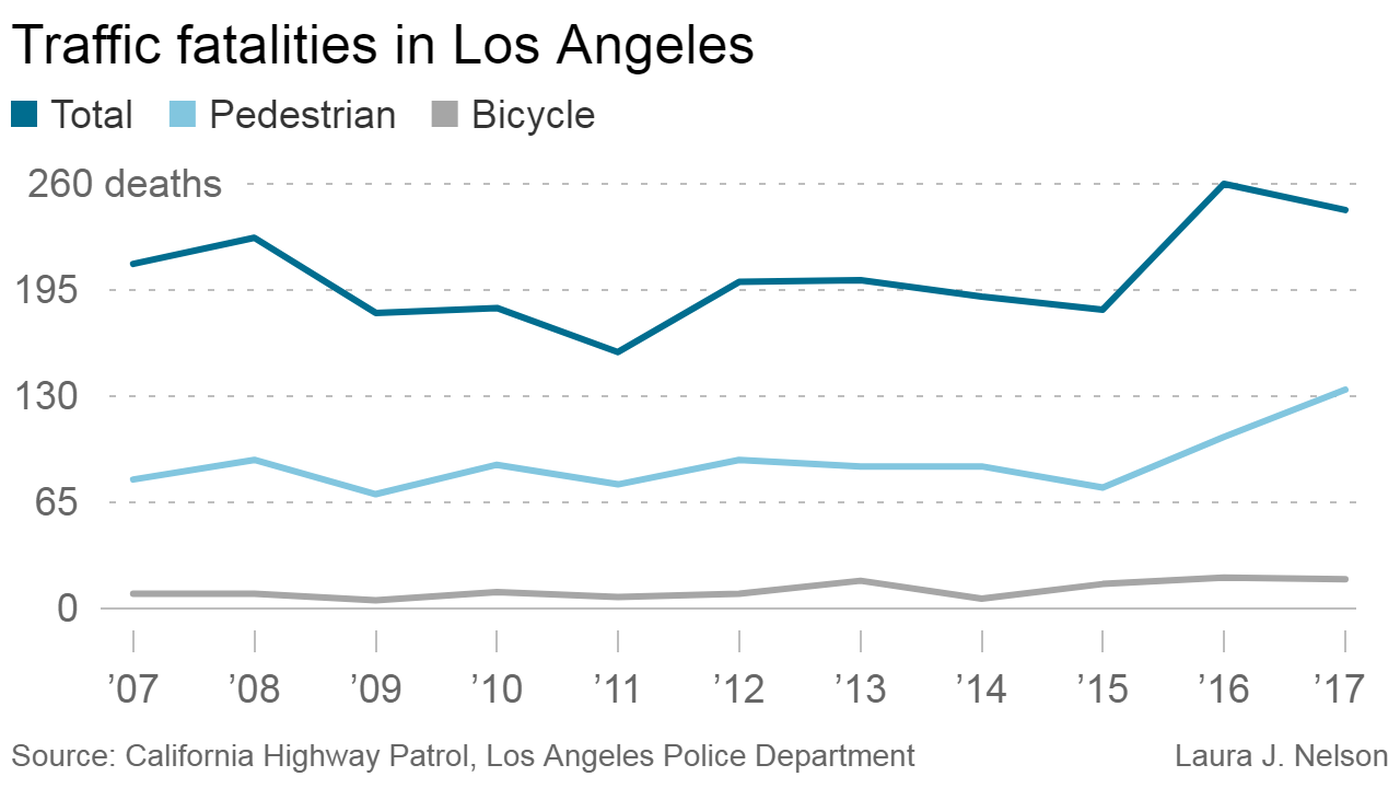
"Pedestrian deaths in Los Angeles have surged more than 80% in the first two years of a high-profile initiative launched by Mayor Eric Garcetti to eliminate traffic fatalities, new data show. In 2015, 74 people on foot were killed by drivers in Los Angeles. That figure rose to 134 in 2017, the highest number in more than 15 years. Overall, the number of bicyclists, pedestrians, motorcyclists and drivers killed in collisions on city streets fell last year by 6%, to 244, according to preliminary police data released by the city Transportation Department.
|
It is obvious why ped fatalities are UP. It doesn't take a Traffic Engineer to figure this out.
The reason why the number of pedestrians being killed by cars has increased (doubled!) in Los Angeles, is because citizens are being encouraged to walk more, but still in places where there are still cars moving at 45 mph, but now on a "Road Diet" and now driven by drivers even MORE in a hurry, because their travel times in the corridor have doubled as a result! The statistics in the United States indicate that there are more instances where a pedestrian can be killed by a vehicle (more pedestrians on the road now), and so it is happening. In China, they have 10 times as many fatalities as we do in the USA (400,000 killed each year versus USA at 40,000, but SAME number of cars on the road, similar miles of road too). Most of those killed in China are pedestrians, there are so many on the roads, and they are vulnerable to mortal danger with fast moving cars. Many transportation planners in the USA and elsewhere have been advocating for getting people out of their cars. The presentations have been colorful and informative, but in cases where public comments were not allowed, these have been contentious meetings. The safest place may be after all, IN one's car, where there is a seat belt, an air bag, and tons of steel protecting occupants from impacts. The statistics for Los Angeles speak for themselves. Pedestrian fatalities have nearly DOUBLED. It is time for transportation planners to give some pause as to whether their ideas have been working, or failing. Find out what is working, and accept what is not working. Truly have the smart growth we all want.
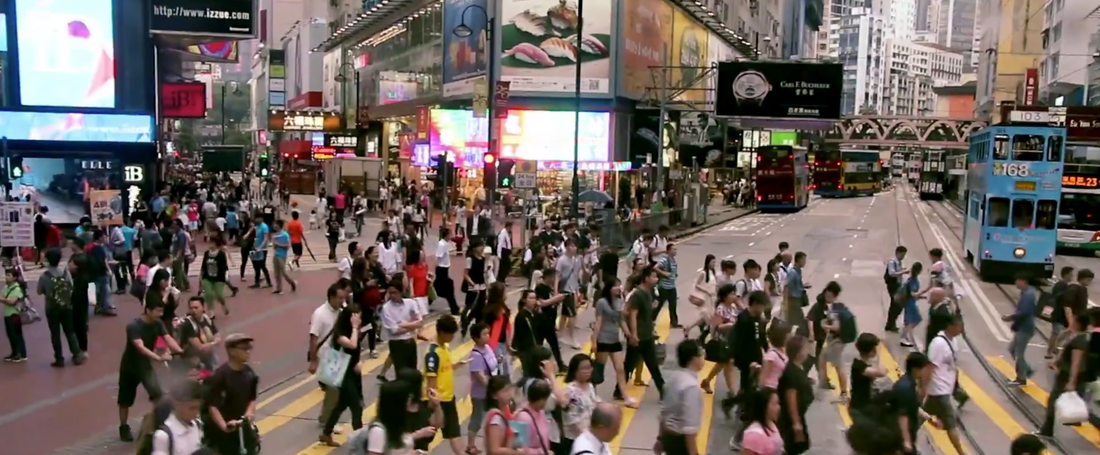
PRISM Engineering advocates for common sense improvements to our transportation system. We need to consider the psychology of people, and consider their comments and opinions. We need to consider the culture as well, and what kind of result happens when solutions are more or less forced upon constituents who still need to get from point A to point B desiring as little delay as possible. Demographics in transportation in the USA are not like China, at all. It is very different when you have 85% of the people walking to and from transit, or just walking, and the other 15% use a car. The US population is only 1/4 of China's 1.3 Billion people, and the ratio of pedestrians to drivers of cars is so significantly different. They walk a lot in China, in the US not so much. Suburban and even urban suburban is the reason, things are more spread out here (excepting in very large China-like cities like SF, LA, Chicago, and NY). 90% of US citizens don't as a general rule, live in skyscraper saturated huge urban centers, so they rely more on cars to get around. Cities like Hong Kong have only 7% of their population who drive cars, and the rest walk, and some of these ride the transit systems. But their pedestrian fatality rate (12 fatalities per 100K vehicles) is 6 times that of the United States average! And two times that of Los Angeles (the city in the USA with the worst pedestrian fatality rate at 6 deaths per 100K vehicles). Why is Hong Kong so high in fatalities? Precisely because there are so MANY pedestrians, and the risk is so high. Only 7% drive, the rest cross streets to get where they are going, Someone is going to occasionally step in front of that car or truck or bus, or the driver won't pay attention, with a much greater frequency than happens in the USA. So we can plainly see this correlation, especially since the street systems in Hong Kong look very similar to those in San Francisco, with trolly cable cars, buses, taxis, and lots of pedestrians (although there are MANY more pedestrians per capita in Hong Kong than in San Francisco). This is what leads to the death rate being so high.
PRISM Engineering advocates for common sense improvements to our transportation system. We need to consider the psychology of people, and consider their comments and opinions. We need to consider the culture as well, and what kind of result happens when solutions are more or less forced upon constituents who still need to get from point A to point B desiring as little delay as possible. Demographics in transportation in the USA are not like China, at all. It is very different when you have 85% of the people walking to and from transit, or just walking, and the other 15% use a car. The US population is only 1/4 of China's 1.3 Billion people, and the ratio of pedestrians to drivers of cars is so significantly different. They walk a lot in China, in the US not so much. Suburban and even urban suburban is the reason, things are more spread out here (excepting in very large China-like cities like SF, LA, Chicago, and NY). 90% of US citizens don't as a general rule, live in skyscraper saturated huge urban centers, so they rely more on cars to get around. Cities like Hong Kong have only 7% of their population who drive cars, and the rest walk, and some of these ride the transit systems. But their pedestrian fatality rate (12 fatalities per 100K vehicles) is 6 times that of the United States average! And two times that of Los Angeles (the city in the USA with the worst pedestrian fatality rate at 6 deaths per 100K vehicles). Why is Hong Kong so high in fatalities? Precisely because there are so MANY pedestrians, and the risk is so high. Only 7% drive, the rest cross streets to get where they are going, Someone is going to occasionally step in front of that car or truck or bus, or the driver won't pay attention, with a much greater frequency than happens in the USA. So we can plainly see this correlation, especially since the street systems in Hong Kong look very similar to those in San Francisco, with trolly cable cars, buses, taxis, and lots of pedestrians (although there are MANY more pedestrians per capita in Hong Kong than in San Francisco). This is what leads to the death rate being so high.
The street systems of these two large cities look and feel similar. However, Hong Kong 香港 has a numerous population of pedestrians using their system!
Transportation Planners need to reconsider the idea that through modifying very busy roads with diets that they can achieve Vision Zero. We can see by stats that in the US people are not abandoning their cars. The trends in the last decade show an increase in US vehicle ownership, and in certain places where Complete Streets Road Diets have been installed on over-capacity road against the wishes of the local citizens, these have shown to increase pedestrian fatalities. This happened last year in Los Angeles. The facts are speaking. It's time to reconsider some of the approaches that have become so popular in this past decade. It is time to more appropriately apply Complete Streets.
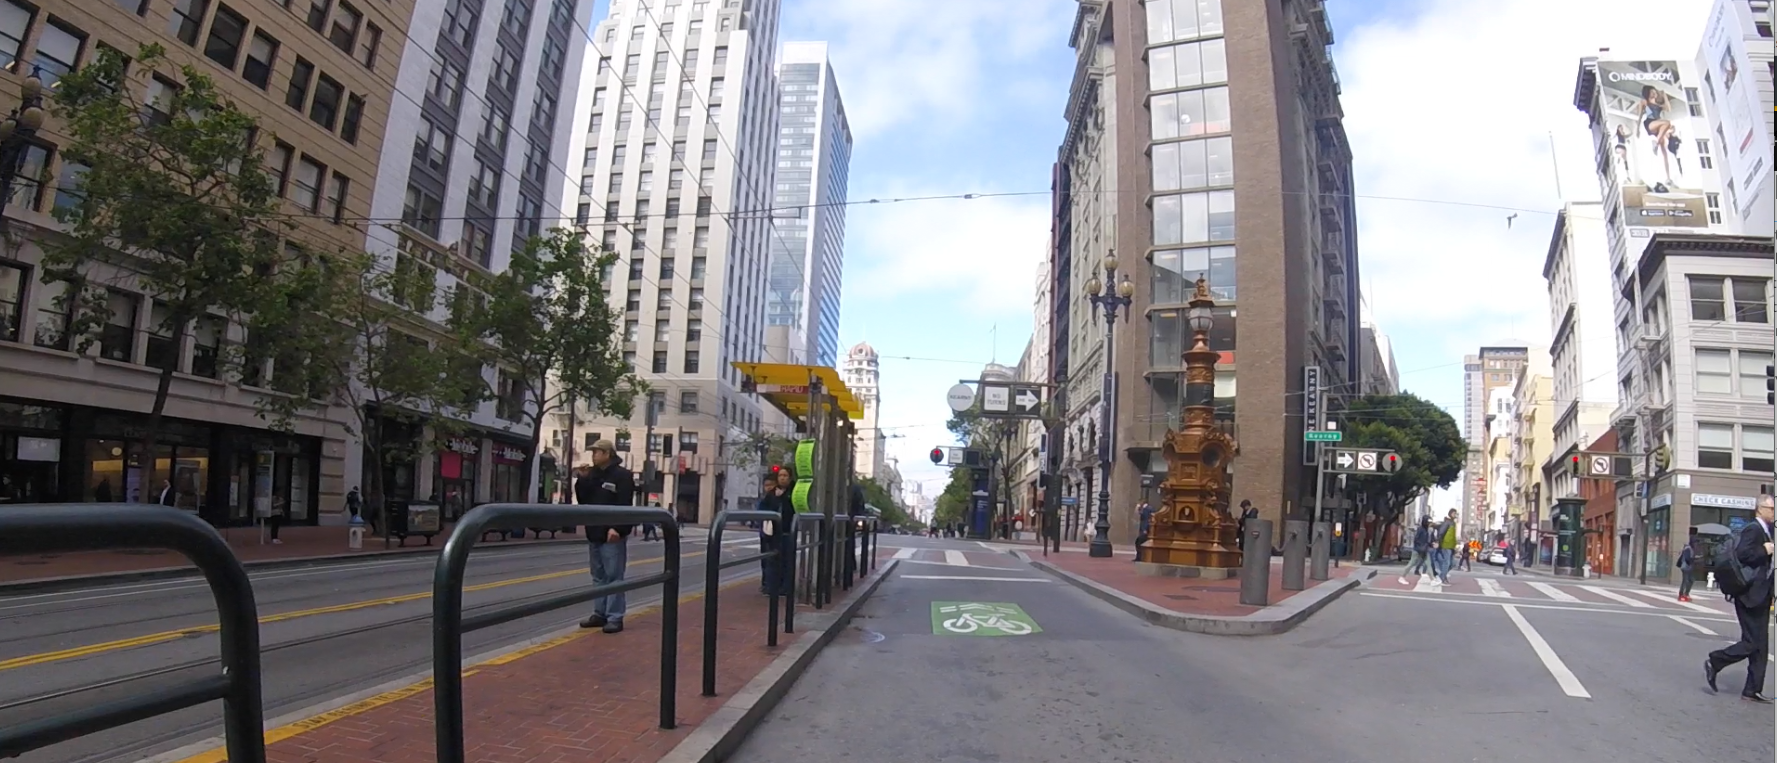
... back to San Francisco‘ Complete Streets Program...
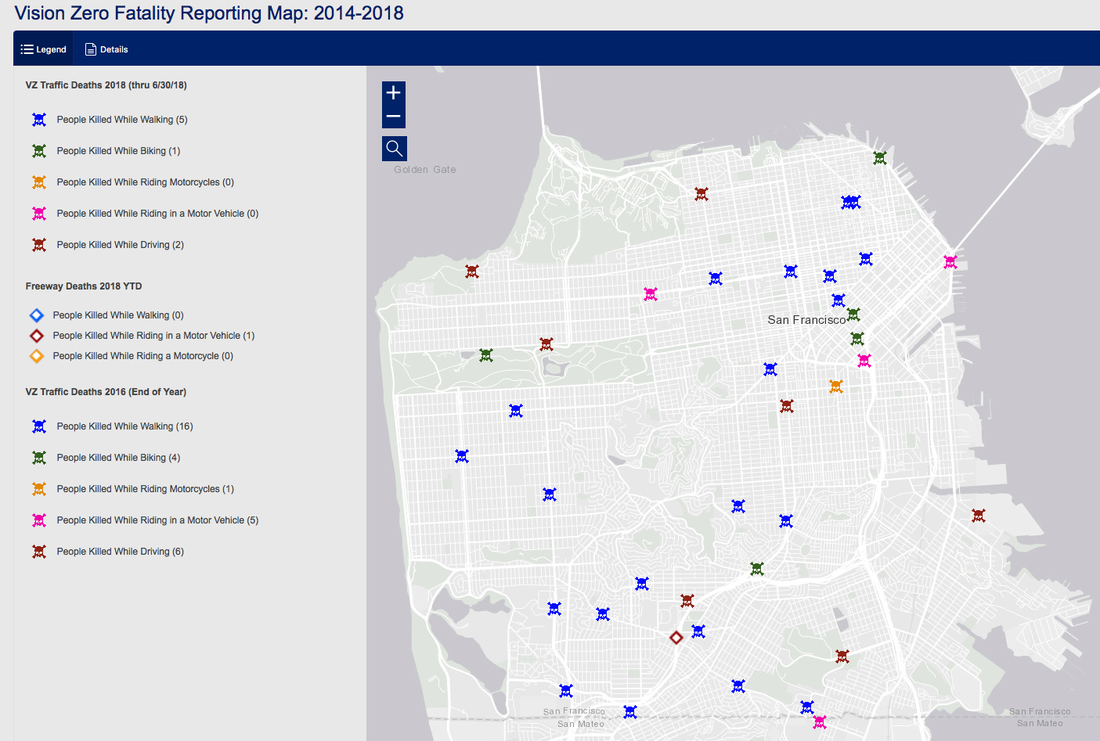
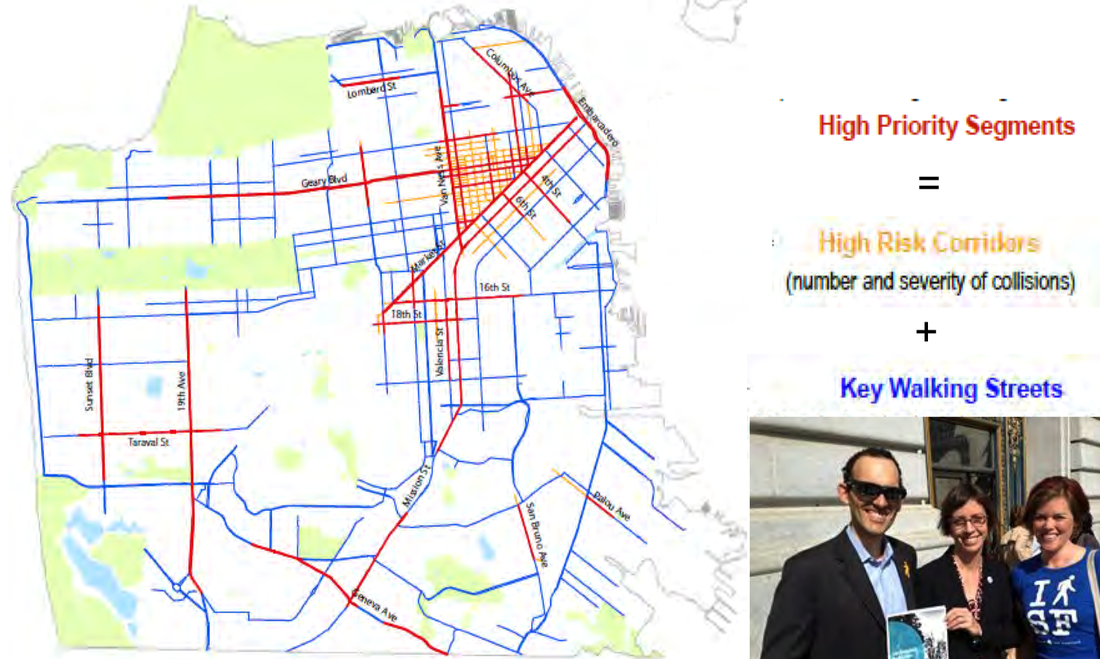
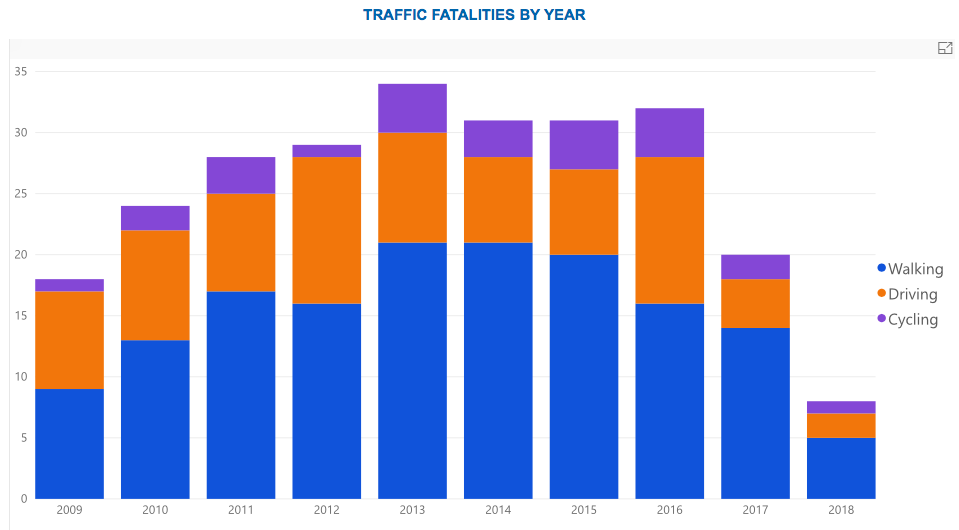
In the following maps from various SF City websites, we see where pedestrian fatalities are taking place (left map, blue X = PED Fatality), and we can correlate this with the map on the right which shows where Complete Streets Priority Segments have been identified and implemented... and those are the red lines, or high priority segments. Many of these fatalities are STILL taking place on roads that are the red lines (priority roads). It is logical to conclude, with this information, that the Complete Streets policies and decisions here have not been moving the needle of pedestrian fatalities in any significant way, as the accidents continue each year. Even the chart below shows that in 2017 SF had MORE pedestrian fatalities than they did in 2009. So far after a decade, this is not a trend that will achieve "Vision Zero" anytime soon, let alone by 2024 as per their goal... but it is showing that the needle did not move much either way for fatalities.
|
In my view, putting a 2018 bar in this chart makes no sense along side the other bars that have a full year's data, because the 2018 bar is only a partial year representing maybe the first quarter or so. Including the 2018 bar "shapes" the curve of the chart as if 2018 was a banner year reduction in fatalities, when in fact, it is not. It might end up being two to three times taller at the end of the year, an entirely different picture. This chart does at first glance give the impression that accidents are WAY DOWN in 2018, which they are not. It is mix of apples and oranges, and maybe should have been projected as a full year using a different color.
|
<<< San Francisco SCORE CARD on FATALITIES by Travel Mode
SOURCE: San Francisco Transportation https://sfgov.org/scorecards/transportation/traffic-fatalities |
So What is the Solution to this?
|
As a Traffic Engineer, don't "social engineer." The Engineer's job is to solve problems, but not be a politician in any way. As an engineer, a problem solver, again its not about setting policy, but to be analytic and creative with what data and constraints we have to work with in traffic engineering. From what I can observe from some of the policies and politics that have been implemented in the past decade, including modifying the Federal Government funding landscape, there has been somewhat of a blind eye turned towards funding sorely needed vehicle-related infrastructure improvements, while channeling federal dollars back to the states and their Metropolitan Planning Organizations (MPO) to be used for bike lanes and pedestrian safety improvements (in the Complete Streets category). In this process of shifting funding from benefitting the vast majority of users of our transportation system, to the much smaller demographic riding bikes and walking (which has brought about some good in equalizing the system, providing a much needed infrastructure for bikes and peds), it has created a safety void for drivers of cars (and pedestrians alike) and the levels of service have plummeted in the last decade. The result is an unintended negative consequence for all modes of travel. Most who drive are tired of long delays or gridlock, but don't see viable alternatives to using their car, and it is not necessarily their fault. Choices in most places are very limited, and not always safer.
Road Diets on a busy corridor that is already over capacity, and then making it twice as bad by taking away 50% of its lanes, is a black eye to what would otherwise be seen as progress. Putting a Road Diet on a corridor that serves a major transportation demand and already at capacity is not a good fit. Better to think about parallel roadway facilities where bike lanes and pedestrians facilities can more safely be accommodated without impact to other modes, and without putting them on dangerous busy corridors with fast moving, sometimes impatient drivers. Lower volume streets are a great candidate for a Road Diet, because it will be SAFE. You do not want to mix pedestrians with high volumes of cars, bumper to bumper, and severely delayed from a Road Diet but anxious to move forward. Establishing the corridor as a lower volume street in the beginning before traffic builds up better PLANNING and more foresight, will help to prevent the kind of stressful environment where fatalities happen between cars and people! |
While most Americans want to bike more, 54 percent said that fear of getting hit by a car or truck holds them back.
|
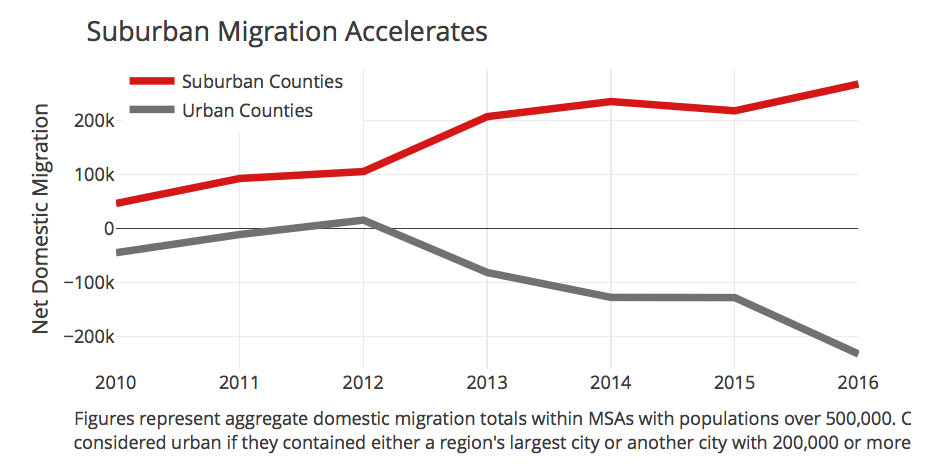
In the mean time, SUBURBAN GROWTH SURGES in 2017, and urban Skyscraper digs are shrinking
I have friends who are moving out of the Bay Area in Northern California, frustrated at what they call GRIDLOCK because they say they can't easily drive around without getting frustrated. Many of these are selling and moving to the hills where it is peaceful, quiet, and where policies have not made things unfairly worse for drivers of cars. A suburban migration IS happening. Its where the new homes are.
This graphic shows that in the USA people are electing to buy suburban places in much higher numbers. Transportation planners need to consider if current policies are having the desired effect, and how the masses affected have been reacting. Are people MOVING OUT of the dense urban cities because the GRIDLOCK is not tolerable? Are the delays high and aggravating, and yet stats show people are NOT giving up their cars to ride a bike overall in the US? The statistics seem to indicate this since there has been a growth in vehicle ownership, now up to 91% per house versus 87% a few decades ago. The bicycle demographic is a lifestyle, one that is a small percentage of the total, precisely because of suburbia and long trips from point A to point B. There ARE solutions that don't include trying to shift modes, get people out of their cars, etc., it involves better Traffic Engineering solutions to keep traffic moving, keep it safer, reduce interactions of pedestrians and bikes with high speed cars (more separations), and better transportation planning... putting homes and businesses where they belong, minimizing traffic impact with a better jobs/housing balance. Easier said than done.
Safety First is the Key.When safety is the driving force, when Vision Zero is really taken seriously, then Engineers will be able to find the solutions that make people SAFE in the transportation system. This can be best done by eliminating the interaction of pedestrians with vehicles, as much as possible. We see what has happened when we INCREASE the number of pedestrians interacting with cars in cities with busy roads, the pedestrian fatality rate increases, like it doubled in Los Angeles recently. Hong Kong also has a 6 times higher pedestrian fatality rate than the USA because most of the participants in their transportation system, a street and sidewalk system similar to San Francisco, but Hong Kong has way more pedestrians on the roads (93% of their population).
So what are the Safety First Solutions?
|
