PRISM ENGINEERING, SAFETY FIRST FOR TRAFFIC ENGINEERING & PLANNING
  • Home
  • SERVICES
    • SERVICES
    • EXPERT WITNESS
    • EXPERIENCE
    • Complete Streets EVOLVED >
      • Complete Streets
    • PROJECTS >
      • TRAFFIC ENGINEERING >
        • SAFETY FIRST focus at PRISM Engineering
        • Autonomous Road Design
    • TRANSPORTATION PLANNING >
      • Autonomous Transportation Planning
    • HSR Construction Inspection Experience
  • Contact
    • About
  • TRAFFIC FACTS
    • INTERNATIONAL TRAFFIC FACTS
    • CALIFORNIA HIGH SPEED RAIL TRAIN TO NOWHERE?
    • SAFETY FIRST Examples
    • PED DANGERS: Death by Subway and Death by UBER
    • Modern Roundabout Examples by PRISM Engineering
    • Death by NYC Subway: PED DANGERS
    • AUTONOMOUS VEHICLES in Traffic >
      • AUTONOMOUS CAR DISRUPTION
      • Autonomous UBER Fatal Accident
    • How About That BIKE COMMUTE?
    • NEWS
  • CHINA TRAFFIC 2018
    • CHINA TRAFFIC 2018
    • HSR High Speed Rail
    • CHINA BLOG
  • STUDIES
    • Watsonville CEIBA School Traffic and Safety Investigation
    • Pasadena 253 S Los Robles v2

traffic safety first

Traffic installations must be designed to be safe for all modes of traffic, especially bikes and peds
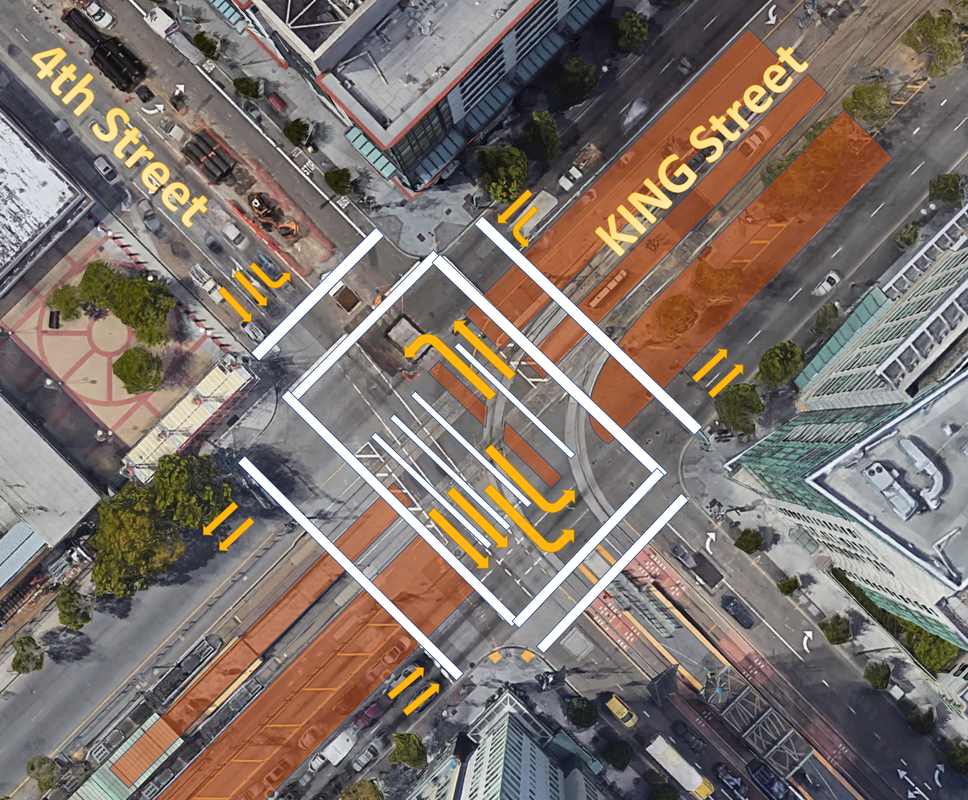
A ROUNDABOUT AT THIS LOCATION IS THE ANSWER. 
200' DIAMETER WITH NO RIGHT-OF-WAY TAKES NEEDED! 
LOS C WOULD BE THE RESULT,
Picture
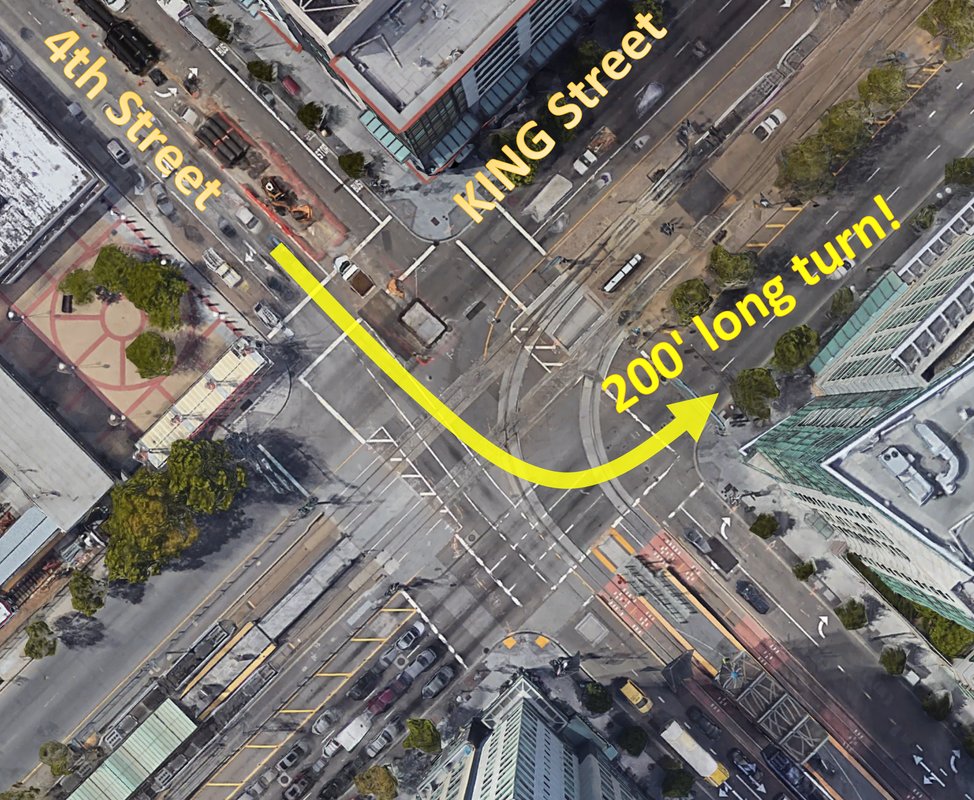
This typical intersection installation (in Fresno, california)
    
is "car-centric"...
and hardly invites bikes or peds to join in. It is a 20 year old design that never worked properly because the signal timing is not optimized, bike lanes were not implemented consistently (ONLY 25% have a receiving lane), and traffic patterns are not adequately considered, as There are too many u-turns taking place, for instance. It currently operates at LOS F conditions as observed on a regular basis,   but it could be at los c conditions always, if certain features were installed (like a roundabout).  Don't let the high speed time lapse fool you in this video. waiting at this intersection for a green light is a long and agonizing event where only a few cars move at a time!  LOS F is where a driver has more than 80 sec delay.  at this intersection, the signal cycle is about double that los f value, and often you have to wait more than one signal cycle, adding another 200 seconds of delay.  It is completely unacceptable.
​photo/video © 2019 PRISM Engineering
Picture

SAFETY. Above all else, Safety is the first priority with PRISM Engineering.
Grant Johnson, Traffic Engineer, Expert Witness, regularly examines the safety of intersections, roadways, and traffic control devices... to determine if the installations are safe, normal, and customary.  Are they CONFUSING?  Was common sense used?  ...or expediency ?

              Below are several examples where "Safety First" did not seem to be the first priority.  Often mode shift is the primary goal. What often is the result is drivers of cars are put in more danger, tasked with more observations to make, and safety is compromised by distractions and "gotcha" traffic "engineering."

Sometimes in the important quest to be more inclusive of bikes and pedestrians on our street systems, and to reduce use of fossil fuels in vehicles by creating a mode shift, transportation planners have prioritized new and untested even colorful traffic control ideas (non-engineered) that visually invite a higher use of bikes and walking, but also may increase the level of confusion on the affected roadways for all users, especially at intersections, and probably especially for drivers of vehicles.  Traffic Engineering was originally based on the idea that cars should move people safely and efficiently.  Safety has always been the primary concern, but as rural and suburban areas have densified and urban areas have increased in the number of pedestrians choosing not to use their cars, safety has been a concern.  More pedestrians than ever, in the USA, have been in harms way and people want a solution.
But non-standard installations are going in under the umbrella of "Complete Streets," (CS) and not enough attention is given to how drivers of cars will react given traffic norms, or how pedestrians and cyclists may feel more safe but in actuality may not safer.  Expectations of drivers of cars matters, and safety in general needs to be paid attention to, accident rates tell the truth.  In the worst of situations, even MORE traffic signs are being installed to heavily regulate drivers, cyclists, and pedestrians.  This increased volume of visual information is even harder to process in time without taking one's eyes off the road, as if there was not enough already to process in existing systems.  Rather than simplify, some CS installations complicate and over-regulate, and the results are higher levels of confusion for the drivers of cars, which naturally leads to accidents waiting to happen.  What good does it do to promote non-auto modes of travel (bikes and peds) if the drivers of cars become more tasked, more confused, and end up hurting riders of bikes and pedestrians as their attention is drawn to an increased number of signs and rules?  Participants in the system are becoming less clear as to what is their specific right of way or rule of the road.  Lanes can change into bus lanes instantaneously, and turns prohibited in random fashion with signage that may be missed.  The danger manifests itself with an obscure regulatory sign or pavement marking that a driver did NOT notice in time, or at all, yet a pedestrian or cyclist may "feel" that they are "protected."  Rather than increasing safety, these type of transportation planners are sometimes doing the opposite.  They are increasing confusion in the system.  Expectations of drivers that do not match expectations of non-drivers.  It is an important factor to consider in traffic engineering.  We need to consider the limitations of the human driver and/or the cooperation of the human driver.  Pedestrian and cyclist death rates are on the rise in recent years, not the other way around.  Safety is being compromised.   Specific examples follow.

Driving in San Francisco

​photo/video © 2019 PRISM Engineering
First of all, credit goes to San Francisco for trying to be progressive and doing new things, to make things better for bikes and pedestrians, BUT>>>
     My very recent experience in driving in San Francisco was much less than assuring as a driver, and at times I felt not only lost in how to get my vehicle around (so many prohibition signs on turns at almost every intersection), but I also felt very much in danger within some super large intersections that have curving rail tracks going through it, some curved, some not, with lane striping, bike striping, huge crosswalks criss-crossing over tracks and each other.  On top of this, signals that were far away and very hard to see and mounted in unexpected places whereas they typically would DEFINE an intersection at the corners. In other words, I felt not only vulnerable to getting hit by a train, but I also felt as if I too might cause an accident at any moment, maybe accidentally hit a bike or pedestrian, so high were the levels of confusion.
Picture
It was so completely confusing!  I was jarred as to how harrowing the experience was.  Safety has got to be the first priority in designing roads and intersections.  We need to simplify.
​photo/video © 2019 PRISM Engineering

So what can be done here to simplify?

A SOLUTION:  CLARIFY the vehicle movement choices at this very large intersection.  Needs striping.  The intersection is too big. The travel paths and turn paths must be clearly delineated.  Widen the median. Raise the median. Add a new Median for 4th Street inside intersection to essentially create TWO intersections.  It operates this way anyway, so delineate it and eliminate the confusion.  King street should be narrowed to one or two lanes in each direction, not three. The median of King Street can be widened which allows for more train station access.  A left turn refuge for CARS can be installed on the 4th Street inside lanes with a median, and specifically signalized with activation detection as needed, but not as a split phase. Get rid of existing split phasing for 4th Street approaches, they are not needed and striping for turns and through lanes are absent or confusing anyway.  Turn 4th Street right turn pockets into a thru/right instead.  Use other lanes for a left turn pocket, which is sorely needed.  Place stop bar of left turn pocket in the median refuge area.

Picture

Simple concept by PRISM Engineering.

AS A STARTING POINT:
Brown areas represent raised median areas with trains in between median areas . white lines are cross walks and lane striping for new left turn channelization. yellow arrows are suggested lane assignments through the intersection.  Bike lanes can fit easily in median areas, as well as pedestrian walking areas, boarding areas for trains, etc.  In this concept, safety is maximized for ALL modes of traffic, and with special improvements for autos, which in my estimation and experience driving this intersection is of the highest priority in order to achieve a safer condition overall.

what it looks like when RR gates don't lower:  
DRIVER EXPECTATION is everything when it comes to safety.
If the driver (or bike or ped) is surprised they may not know how to react.   In this video, even a trained law enforcement officer barely had time to react to the unobvious, narrowly missing a fatal accident!  Watch as the railroad gates lowered down about 10 seconds after the train was already rolling through the intersection.  The vehicle gates lowered late, and the pedestrian gates also lowered late.  Eight different points of entry were at risk.  This is equivalent to a signal giving everybody a green light, but only one should have had the green light (the train).

Just because you can build something doesn't mean you should build something. Case in point, this unnecessarily confusing many-headed traffic circle in England.

NEXT...

"MAGIC" Roundabouts
in England

Source: google.com
Like a RUBIK'S CUBE of intersections, this multi-headed traffic circle intersection in England is a complicated puzzle, a virtually impossible puzzle to solve on the fly by the unsuspecting driver who has never previously navigated it.  Why do it?  Why make this?  An ordinary and customary modern roundabout would have sufficed just fine.  Why contribute to driver confusion??  There is no way that a pedestrian, for instance, let alone a cyclist would be safe in this puzzle of turning movements!
This video contrasts the incredible "Magic Roundabout" complexity in Swindon, England with a very simple modern roundabout in Fresno, CA USA.  The difference is that in the Swindon "roundabout" there are 7 traffic circles mixed together which is a driving experience not for the faint of heart, or for one who is prone to panic.   Sometimes when things are so OBVIOUSLY dangerous and complicated, people are more cautious and careful, drive slower.  However, this kind of compound traffic circle is not necessary, and in fact, will suffer from performance as people drive even slower and more unsure if they should move or not.  Its a capacity nightmare, and there are many videos that show this intersection at a standstill with long long lines in a serpentine path, on the brink of gridlock. Highly un-recommended!   It could be redesigned to move a much higher volume of traffic, safer and at the same low speeds, but with efficiency and giving drivers unfamiliar with the intersection a fighting chance to get through without having a panic attack.

In the GOOD example roundabout, the simple Fresno modern roundabout in the Riverpark Shopping Center entry road is also shown.  One can see the simplicity of its design, understated, and with a complete lack of congestion or confusion.   All drivers know what to do.  Yield on entry.  If traffic volumes increase in these kind of roundabouts, they can be designed or expanded to have two or three lanes interfacing with the circle. 
SMART GROWTH AMERICA has been promoting the idea that there is strength in numbers, as far as pedestrians and cyclists are concerned.  Based on a study put together by a public health consultant, not a traffic engineer, the conclusions of his study were that it was safer for pedestrians and cyclists if there were more of them on the road, but this does not bear out in other parts of the world where the pedestrian density HAS been achieved even 33 times higher than the USA (in China).  The controversial study is labeled: "Safety in numbers: more walkers and bicyclists, safer walking and bicycling."

NEXT...

Picture
It is important that there is not any confirmation bias in producing study results. It is important that the larger picture not be ignored.  Studies must also pass the common sense test. There are facts in the world today that directly contradict the results and findings of this study, based on obvious observations of known traffic accident rates for fatalities per 100K vehicles, known facts in numerous developed countries.  This is discussed in great detail on PRISM Engineering's TRAFFIC FACTS page where it shows how traffic fatality rates compare between countries.  It also shows that when fatality rates are based on a country's population or a per capita metric, this does not take into consideration the complete apples and oranges comparison that this is! In fact, many countries like China and India have a vast majority of citizens who do not even drive (85-90%), so these population based rates are averaging in the rural population (50%) who DON'T USE CARS and don't interact regularly with cars (i.e. in urban centers), so this just waters down the TRUE fatality accident rate, making it appear that not too many people die per capita (the pedestrian denominator is so large!)  But since in China the "per capita" denominator is a very very large number, even 33 times larger than the USA, if an accident fatality rate is based on this it appears there is no problem.  But China has 400,000 vehicle and ped fatalities each year, USA has 40,000.  The fatality rate should be based on the number of vehicles on the roads (say, per 100K vehicles), not the population, many who are NOT even on the roads.  Why would these be averaged in the fatality rate??  The accident rates, when based on vehicle miles traveled is also erroneous as a true comparison between countries, because it depends on vehicle ownership in a country, culture, vehicle use, etc., because in the USA where nearly all own and use cars (91% of households own at least one car), many are driving longer distances to commute.  This is more rare in countries with fewer vehicle owners (who are generally more wealthy, can also afford to live where it is expensive and near the jobs, and don't necessarily need to commute by car, but want the status symbol of owning a car, even when transit or walking can actually be faster!). 
A CLOSER LOOK AT:  "Safety in numbers: more walkers and bicyclists, safer walking and bicycling."
Key Points from this Study
  • The likelihood that a given person walking or bicycling will be struck by a motorist varies inversely with the amount of walking or bicycling.


  • It appears that motorists adjust their behavior in the presence of people walking and bicycling. There is an urgent need for further exploration of the human factors controlling motorist behavior in the presence of people walking and bicycling.


  • CONCLUSION:A motorist is less likely to collide with a person walking and bicycling if more people walk or bicycle. Policies that increase the numbers of people walking and bicycling appear to be an effective route to improving the safety of people walking and bicycling.


Counter-point Questions/Comments by PRISM Engineering
  • This does not comport with known facts throughout the world, where in countries where car ownership is only 10% and the pedestrian fatalities are 10 times higher than the USA, where car ownership is 90%, and there are far fewer pedestrians on the streets.  Also, being "struck" by a motorist is very different from being KILLED by a motorist.  Since the fatality rate is the primary comparison, all other non-fatal accidents are far less relevant to the discussion about what is an effective solution.
  • What appears and what actually IS, may be two different things.  The fact is, in China where the number of vehicles on the roads there is approximately equivalent to the numbers on the road in the USA, yet they have 10 times as many fatalities, most of which are pedestrians and cyclists.  40,000 vehicle related deaths take place each year in the USA.  But 10 times as much or 400,000 deaths take place each year with a vehicle in China.  Same number of cars! and trucks!  Same miles of roads!  but with 1.4 billion people, 85% of whom don't own a car and WALK or BIKE daily to get around or to the transit system.  That's 1200 MILLION pedestrians on the roads and sidewalks of China, each day, compared with say 12% of USA citizens, or only 39 MILLION.  China has 33 times more people on the streets than USA!
  • It can NOT be concluded that people are safer in numbers, as this study loosely concluded,  because this is NOT the case in China where the number of pedestrians outnumbers the USA by a factor of 33!  There are 10 times more fatalities per 100K vehicles in China than the USA, which has 40,000 fatalities, and China has 400,000 each year.  The only common sense difference is the vastly different number of pedestrians in China, 33 times more, and they have the same number of miles of road and same number of cars on the road. It can only be concluded that more pedestrians mixed with motor vehicles is NOT a safe idea, and should be disgarded if we are to make any progress on that 40,000 fatalities number. It has increased in recent years, BECAUSE the number of pedestrians and bikes are also increasing. There is correlation that can be verified by what is happening in other countries, like China.
From the Governor's Highway Safety Association (GHSA):  The number of pedestrian fatalities in the United States (U.S.) increased 25 percent. from 2010 to 2015, while at the same time, total traffic deaths increased by about six (6) percent. Pedestrians now account for the largest proportion of traffic fatalities recorded in the past 25 years. 
In 2007 pedestrians deaths were 11% of the total, and in 2013 this jumped to 15% and remains slightly increasing to this day.

Pedestrian Traffic Fatalities by State https://www.ghsa.org/sites/default/files/2017-03/2017ped_FINAL_4.pdf

Website Copy and Media © 2016-2023 b y Grant Johnson, PRISM Engineering
  • Home
  • SERVICES
    • SERVICES
    • EXPERT WITNESS
    • EXPERIENCE
    • Complete Streets EVOLVED >
      • Complete Streets
    • PROJECTS >
      • TRAFFIC ENGINEERING >
        • SAFETY FIRST focus at PRISM Engineering
        • Autonomous Road Design
    • TRANSPORTATION PLANNING >
      • Autonomous Transportation Planning
    • HSR Construction Inspection Experience
  • Contact
    • About
  • TRAFFIC FACTS
    • INTERNATIONAL TRAFFIC FACTS
    • CALIFORNIA HIGH SPEED RAIL TRAIN TO NOWHERE?
    • SAFETY FIRST Examples
    • PED DANGERS: Death by Subway and Death by UBER
    • Modern Roundabout Examples by PRISM Engineering
    • Death by NYC Subway: PED DANGERS
    • AUTONOMOUS VEHICLES in Traffic >
      • AUTONOMOUS CAR DISRUPTION
      • Autonomous UBER Fatal Accident
    • How About That BIKE COMMUTE?
    • NEWS
  • CHINA TRAFFIC 2018
    • CHINA TRAFFIC 2018
    • HSR High Speed Rail
    • CHINA BLOG
  • STUDIES
    • Watsonville CEIBA School Traffic and Safety Investigation
    • Pasadena 253 S Los Robles v2