traffic engineering Review
CITY OF PASADENA
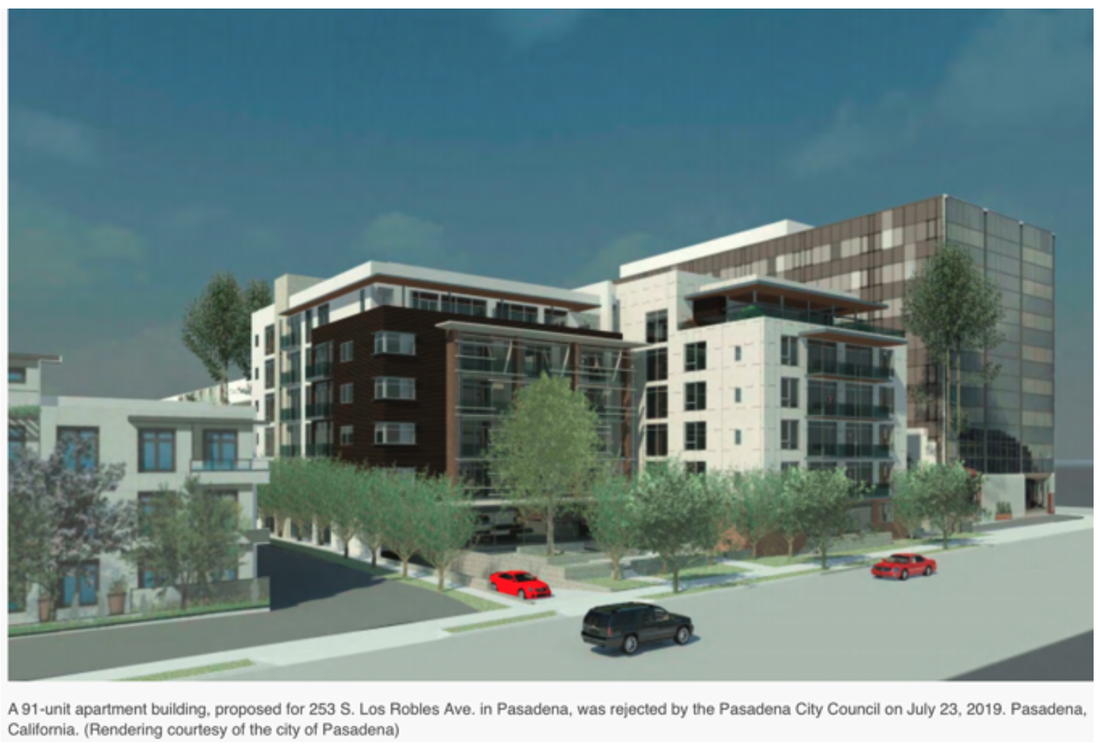
253 South Los Robles and
related traffic issues
Prepared for:
Madison Heights neighborhood association, mhna
656 s. arroyo parkway, suite 199
pasadena, ca 91105
Madison Heights neighborhood association, mhna
656 s. arroyo parkway, suite 199
pasadena, ca 91105